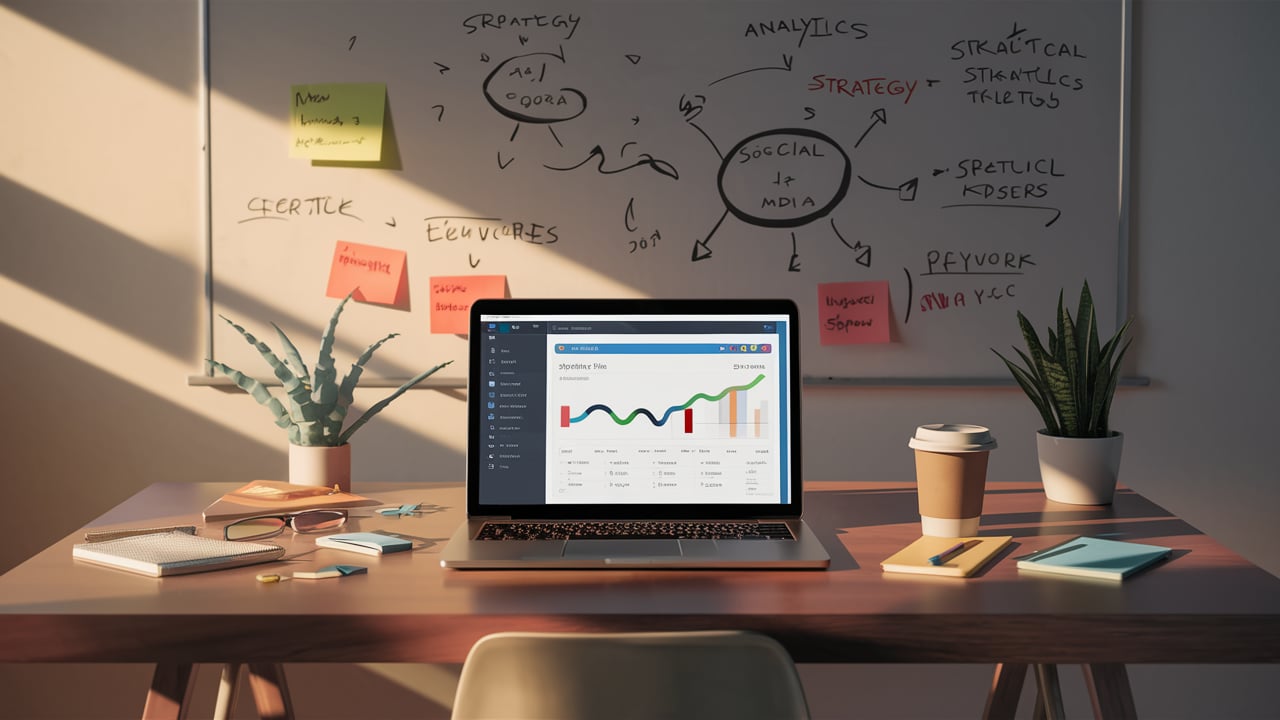
A dashboard is a tool that provides a graphical and accessible view of key information for data analysis. With their intuitive and customizable design, dashboards provide an instant overview of the most important indicators and metrics for a business or project, facilitating decision-making and monitoring results.

Table of Contents
ToggleHow does a dashboard work?
A dashboard is an interface that collects and displays real-time information in a visual and understandable manner. This information is represented in the form of graphs, charts, and other graphical elements that allow for easy interpretation of the data.
Components of a dashboard
- Widgets and Visuals: Dashboards are typically composed of various widgets, such as bar charts, line graphs, gauges, tables, and maps. These elements are used to visually represent data.
- Connecting to data sources: Dashboards connect to different data sources, such as databases, spreadsheets, or APIs, to obtain the information needed for visualization.
- Customization: Dashboards are often customizable, allowing users to tailor the interface to their specific needs. Widgets can be added, removed, or rearranged to provide the most relevant information based on the analysis objectives.

Benefits of using a dashboard
A dashboard offers a number of benefits for analyzing business or project data. Some of the most notable benefits include:
- Instant data visualizationDashboards allow for real-time visualization of the most relevant data, facilitating quick, information-based decisions.
- Clear interpretation of data: Thanks to the visual representation of data, it is easier to interpret and understand the information, even for those without experience in data analysis.
- AccessibilityDashboards are typically accessible from any internet-connected device, allowing you to access information anytime, anywhere.
- Improving collaborationDashboards can be shared with different team members, facilitating collaboration and teamwork.
- Rapid identification of trends and patternsVisualizing data in a dashboard makes it easy to quickly identify trends, patterns, and anomalies in your data, which can be key to strategic decision-making.

Examples of dashboards
There are different types of dashboards, adapted to the different needs and objectives of each business or project. Some examples of common dashboards are:
1. Sales Dashboard
A sales dashboard allows you to visualize sales performance in real time, displaying metrics such as total sales, number of units sold, revenue by product, sales by region, and other key indicators.
Examples of KPIs for the sales dashboard:
- Total sales
- Sales by product
- Sales by region
- New customers vs. returning customers
2. Marketing Dashboard
A marketing dashboard allows you to understand and analyze the performance of your marketing strategies, displaying metrics such as website visits, bounce rate, conversions, return on investment (ROI), and other key indicators.
Examples of KPIs for the marketing dashboard:
- Website visits
- Bounce rate
- Conversions
- ROI of advertising campaigns
3. Human Resources Dashboard
A human resources dashboard allows you to view key indicators related to a company's workforce, such as employee numbers, turnover rates, work environment, hiring costs, and other relevant indicators.
Examples of KPIs for the HR dashboard:
- Number of employees
- Turnover rate
- Hiring costs
- Work environment
In short, dashboards are essential tools for data analysis, allowing you to visualize the most relevant information in a clear and accessible way. Their customizable design and ability to connect to different data sources make them indispensable allies for making informed decisions in any type of business or project.

Conclusion
Dashboards are a powerful tool for data analysis, facilitating visualization, interpretation, and decision-making based on relevant and up-to-date information. Their customizable design and ability to connect to different data sources make them a versatile and useful tool for all types of businesses and projects.

Frequently asked questions
How can I create a dashboard in Excel?
- To create a dashboard in Excel, you can use pivot tables and charts. These will allow you to create a clear and easy-to-understand visualization of your data. You can also use specific add-ins and templates to create dashboards in Excel.
Is it necessary to have technical knowledge to use a dashboard?
- Not necessarily. Many dashboard creation tools offer intuitive and easy-to-use interfaces, allowing anyone, even without advanced technical knowledge, to create and use a dashboard effectively.
What type of data can I display on a dashboard?
- Dashboards can visualize a wide variety of data, such as sales, marketing, human resources, finance, and more. You can graphically represent numerical data, percentages, dates, geographic locations, and more.
Do dashboards always display real-time data?
- Not necessarily. While dashboards can display real-time data, it's also possible to use historical data or periodically updated data, depending on the needs of the analysis.
What tools can I use to create dashboards?
- There are many tools available for creating dashboards, both free and paid. Some of the most popular are Tableau, Power BI, Google Data Studio, Excel, and QlikView. Each of these tools offers different functionalities and features, so it's important to evaluate which one best suits your needs.


